ML - Coursera Andrew Ng - Week1 & Week2 & Ex1 - Linear Regression - 筆記與代碼
Week 1和Week 2主要講解了機器學習中的一些基礎概念,并介紹了線性回歸算法(Linear Regression)。
機器學習主要分為三類:
- 監督學習(Supervised Learning):已知給定輸入的數據集的輸出結果。監督學習是學習輸入和輸出之間的映射關系。根據輸出值的類型監督學習問題可分為回歸(regression)問題和分類(classification)問題。如果輸出值是連續的,即為回歸問題;如果輸出值是一個離散的有限集合,即為分類問題。
- 非監督學習(Unsupervised Learning):給定的數據集只有輸入沒有輸出結果。非監督學習是為了發現數據集之間的隱藏結構關系。非監督學習中,有一個重要的方法稱為聚類(clustering algorithm),聚類算法是把具有相同特征的數據聚集在一組。
- 其它:Reinforcement learning, recommender systems
根據輸入的特征變量個數,可將線性回歸分為單變量線性回歸與多元線性回歸(multivariate linear regression)。線性回歸的圖像是條直線,不一定能很好的擬合數據,可以通過多項式回歸(polynomial regression),增加多項式來改變圖像曲線。
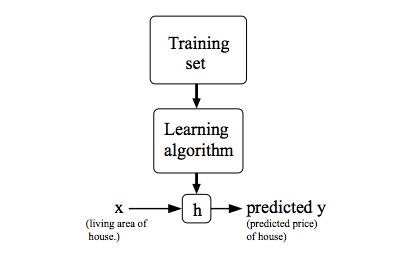
監督學習模型中,需要構建一個假設函數(hypothesis function)h(x)用于擬合輸入與輸出之間的映射關系,再構建一個損失函數(cost function)J(θ)用于衡量假設函數擬合的準確度。擬合最好的情況是所有點到擬合圖像的垂直距離的平方和的平均值最小。為了使損失函數最小化,我們需要找出合適的θ參數,可以通過梯度下降算法(Gradient Descent)來進行parameter learning。梯度下降算法的基本思想是先確定一個初始的θ值和學習速率α,然后對損失函數J(θ)求梯度,θ值在求出的梯度的方向的指引下,以學習速率和梯度大小的乘積為步長進行迭代,直至收斂(convergence)。在損失函數圖像中,梯度下降算法即是從一個θ初始點出發,不斷向圖像的global minimum收斂的過程(容易受local minima影響)。如果不同輸入特征變量之間的值域相差過大,會是梯度下降算法的運行速度變慢,可以用特征縮放(feature scaling)和均值歸一化(mean normalization)來加速。
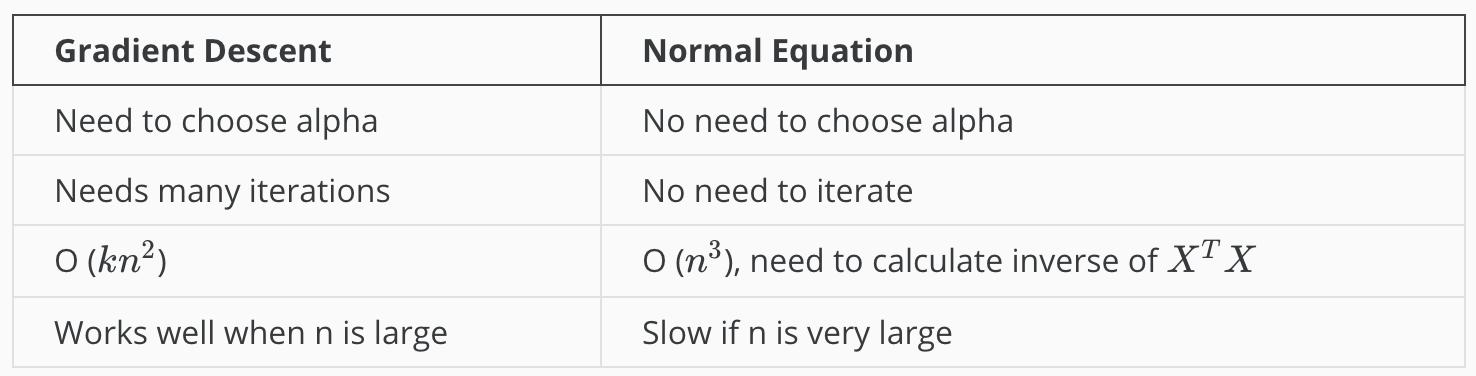
除了使用梯度下降算法,也可以用標準方程(normal equation)直接計算得到最優參數θ。
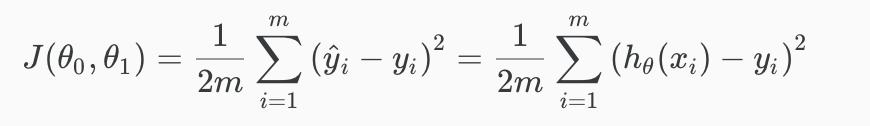
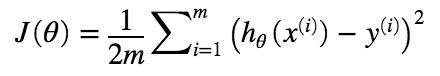
Cost Function
對于最簡單的單變量線性回歸模型,我們的假設函數。損失函數也稱作平方誤差函數(squared error function / mean squared error),
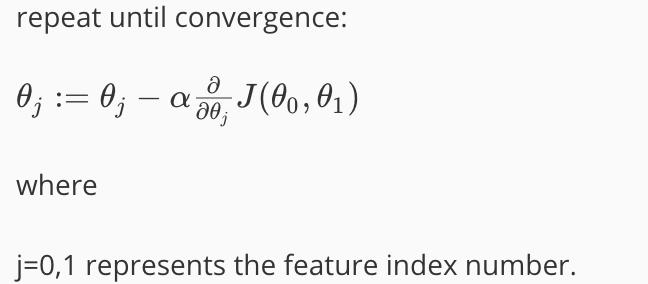
Gradient Descent
梯度下降算法核心是不斷地對損失函數求導(derivative, the slope of the tangent),用導數作為在該點的前進方向,沿著損失函數,向最低點前進。每一步的大小由learning rate α決定。不需要隨時調整α的大小,哪怕α是個固定值,隨著靠近local minimum,gradient descent也會自動取更小的步伐。如果α過小,gradient descent會非常的慢;如果α過大,gradient descent可能會錯過最小值,無法收斂,甚至會diverge。
單變量線性回歸的梯度下降,
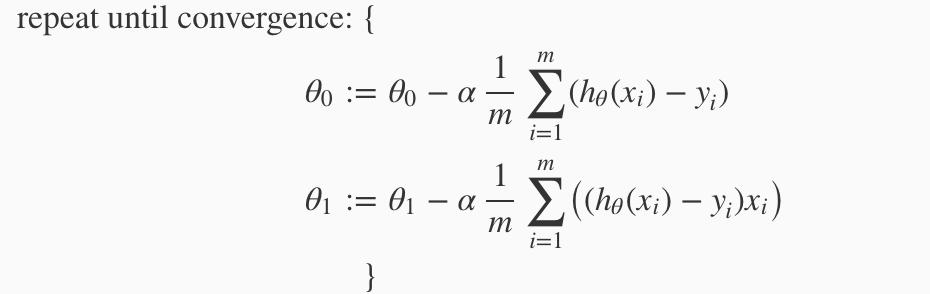
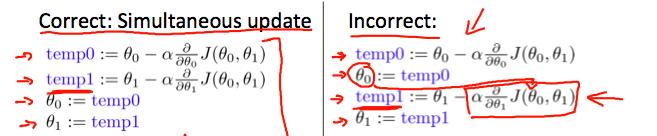
在每次迭代的過程中,要同時更新所有參數的值。
Multivariate Linear Regression
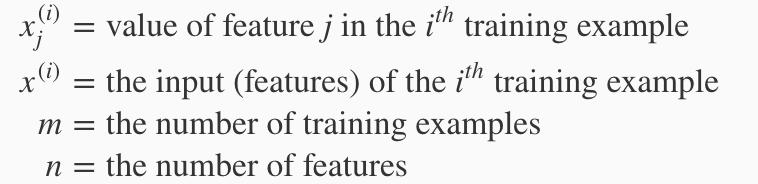
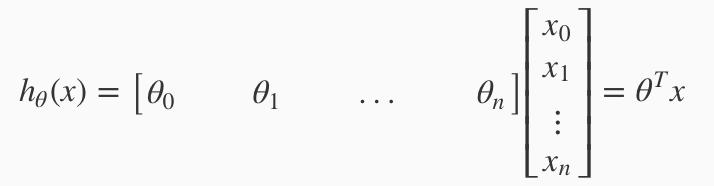
Hypothesis function,

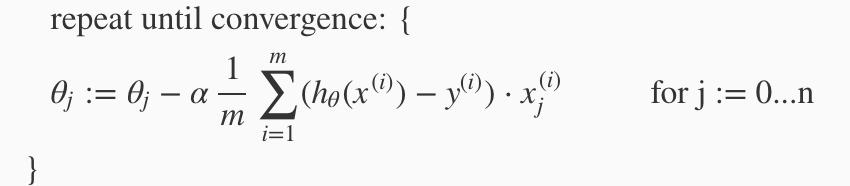
Gradient descent,
Feature Scaling & Mean Normalization
通過使不同輸入特征變量的值域大概在同一個范圍內,來加速梯度下降算法。一般有feature scaling和mean normalization兩種方法。
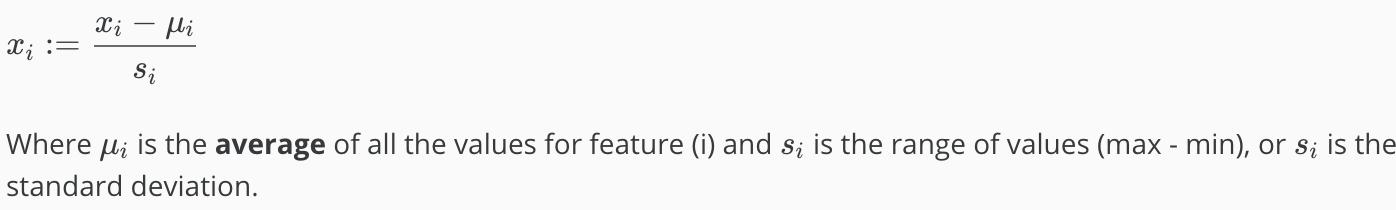
特征縮放是用輸入變量值分別除以輸入值的值域區間長度。

均值歸一化是用每個輸入值減去輸入值的均值后,除以輸入值的值域區間長度或者輸入值的標準差。
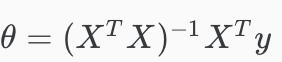
Normal Equation
標準方程不需要進行特征縮放操作。當n很大的時候,標準方程也會很耗時,例如當n > 10000時,用迭代操作可能會更好些。
Exercise 2: 實現線性回歸 - Matlab
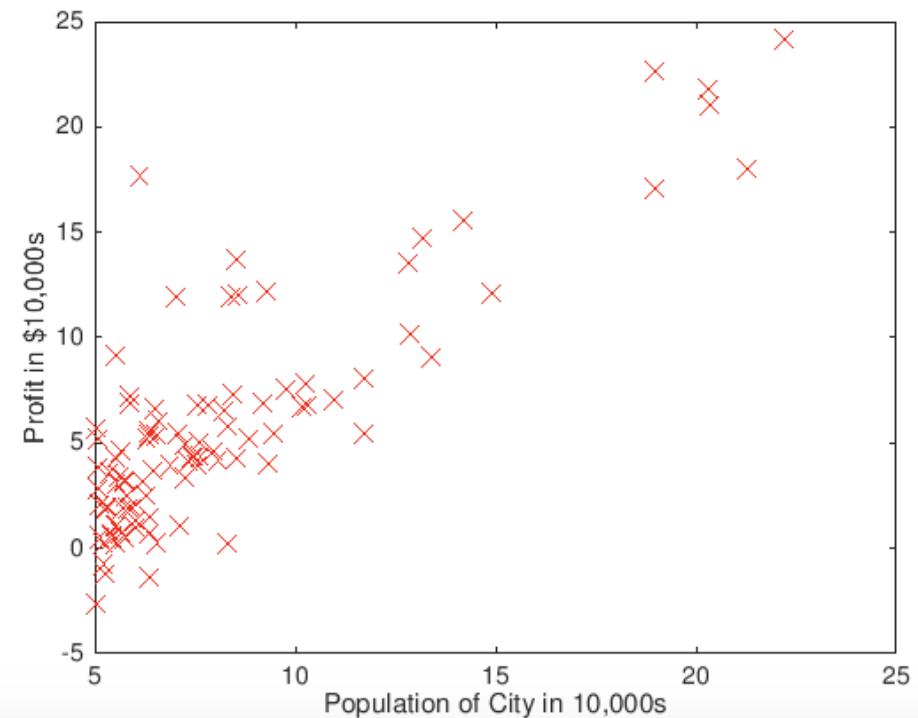
作為一個餐飲行業的老板,考察分店開設,給的數據集包括各個城市的人口與盈利。完成單變量線性回歸,尋找人口與盈利之間的關系。
1. Plotting Data
根據提示,在plotData.m中完成繪制圖像的任務。
function plotData(x, y)
%PLOTDATA Plots the data points x and y into a new figure
%   PLOTDATA(x,y) plots the data points and gives the figure axes labels of
%   population and profit.

figure; % open a new figure window

% ====================== YOUR CODE HERE ======================
% Instructions: Plot the training data into a figure using the
%               "figure" and "plot" commands. Set the axes labels using
%               the "xlabel" and "ylabel" commands. Assume the
%               population and revenue data have been passed in
%               as the x and y arguments of this function.
%
% Hint: You can use the 'rx' option with plot to have the markers
%       appear as red crosses. Furthermore, you can make the
%       markers larger by using plot(..., 'rx', 'MarkerSize', 10);

plot(x, y, 'rx', 'MarkerSize', 10);
ylabel('Profit in $10,000s');
xlabel('Population of City in 10,000s');

% ============================================================

end
2. Cost Function
在computeCost.m文件中,根據損失函數模型,完成損失函數的計算。
function J = computeCost(X, y, theta)
%COMPUTECOST Compute cost for linear regression
%   J = COMPUTECOST(X, y, theta) computes the cost of using theta as the
%   parameter for linear regression to fit the data points in X and y

% Initialize some useful values
m = length(y); % number of training examples

% You need to return the following variables correctly
J = 0;

% ====================== YOUR CODE HERE ======================
% Instructions: Compute the cost of a particular choice of theta
%               You should set J to the cost.

J = sum((X * theta - y) .^2) / 2 / m;

% =========================================================================

end
3. Gradient Descent
在gradientDescent.m中,完成梯度的計算。

function [theta, J_history] = gradientDescent(X, y, theta, alpha, num_iters)
%GRADIENTDESCENT Performs gradient descent to learn theta
%   theta = GRADIENTDESCENT(X, y, theta, alpha, num_iters) updates theta by
%   taking num_iters gradient steps with learning rate alpha

% Initialize some useful values
m = length(y); % number of training examples
J_history = zeros(num_iters, 1);

for iter = 1:num_iters

    % ====================== YOUR CODE HERE ======================
    % Instructions: Perform a single gradient step on the parameter vector
    %               theta.
    %
    % Hint: While debugging, it can be useful to print out the values
    %       of the cost function (computeCost) and gradient here.
    %

    theta = theta - X' * (X * theta - y) * (alpha / m);

    % Save the cost J in every iteration
    J_history(iter) = computeCost(X, y, theta);

    % ============================================================

end

end
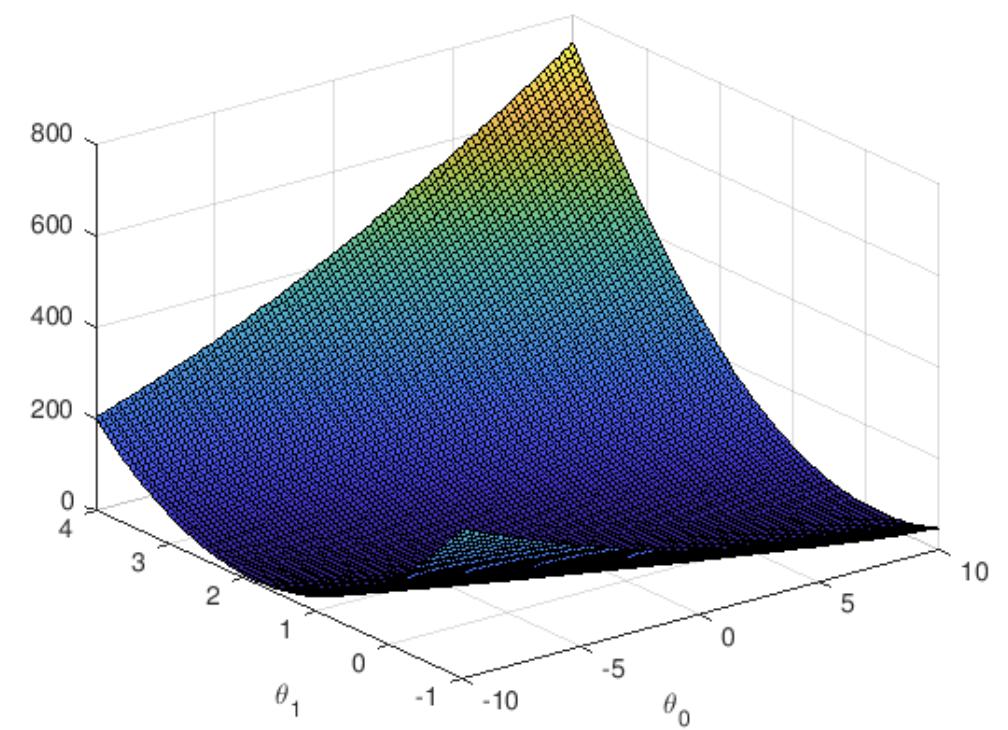
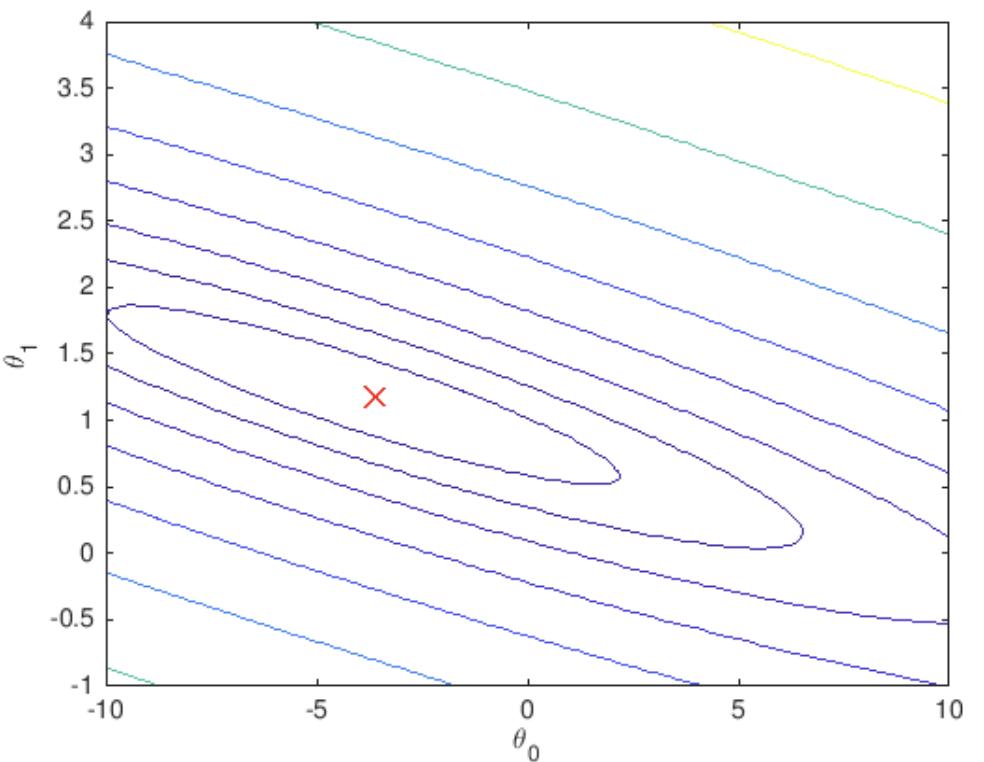
4. Visualizing J(θ)
用surf和contour命令畫出來的圖像分別如下所示。
Ex1完整代碼已上傳Github。
智能推薦
Coursera | Andrew Ng (02-week3-3.11)—TensorFlow
該系列僅在原課程基礎上部分知識點添加個人學習筆記,或相關推導補充等。如有錯誤,還請批評指教。在學習了 Andrew Ng 課程的基礎上,為了更方便的查閱復習,將其整理成文字。因本人一直在學習英語,所以該系列以英文為主,同時也建議讀者以英文為主,中文輔助,以便后期進階時,為學習相關領域的學術論文做鋪墊。- ZJ Coursera 課程 |deeplearning.ai |網易云課堂 轉載請注明作者和...

【吳恩達機器學習筆記】Week2 ex1答案
數據歸一化有兩種方法:https://blog.csdn.net/program_developer/article/details/78637711 改變alpha得到不同的J 備注:兩次預測price時,雖然都是1650-square-foot house with 3 bedrooms,但是兩種求theta方法得到的thete2的量級是不一樣的,所以當使用Gradient Descent時,...
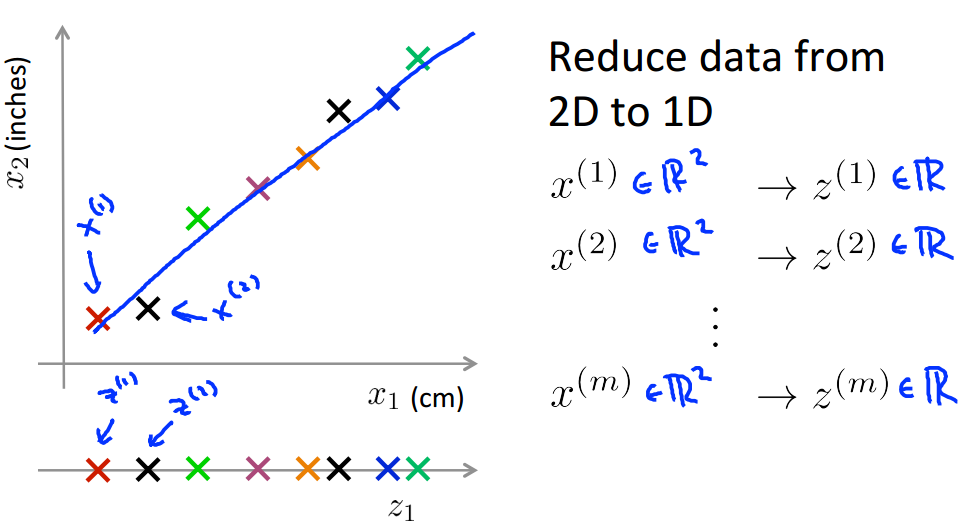
Coursera 機器學習(by Andrew Ng)課程學習筆記 Week 8(二)——降維
此系列為 Coursera 網站機器學習課程個人學習筆記(僅供參考) 課程網址:https://www.coursera.org/learn/machine-learning 參考資料:http://blog.csdn.net/MajorDong100/article/details/51104784 一、降維的作用 1.1 數據壓縮 數據壓縮(Data Compression)不僅能減少數據的存...
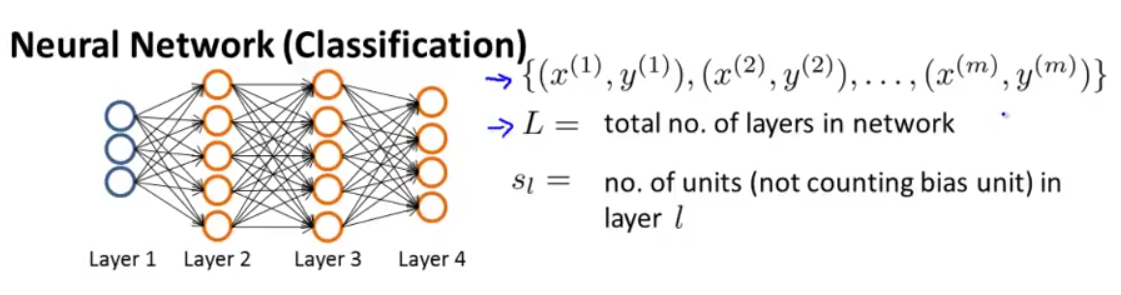
Coursera 機器學習(by Andrew Ng)課程學習筆記 Week 5——神經網絡(二)
此系列為 Coursera 網站機器學習課程個人學習筆記(僅供參考) 課程網址:https://www.coursera.org/learn/machine-learning 參考資料:http://blog.csdn.net/SCUT_Arucee/article/details/50176159 一、神經網絡的代價函數 1.1 神經網絡的模型參數 假設我們有下圖這樣的神經網絡: 我們定義以下符...

【Machine Learning】【Andrew Ng】- notes(Week 3: Logistic Regression Model)
Cost Function We cannot use the same cost function that we use for linear regression because the Logistic Function will cause the output to be wavy, causing many local optima. In other words, it will ...
猜你喜歡
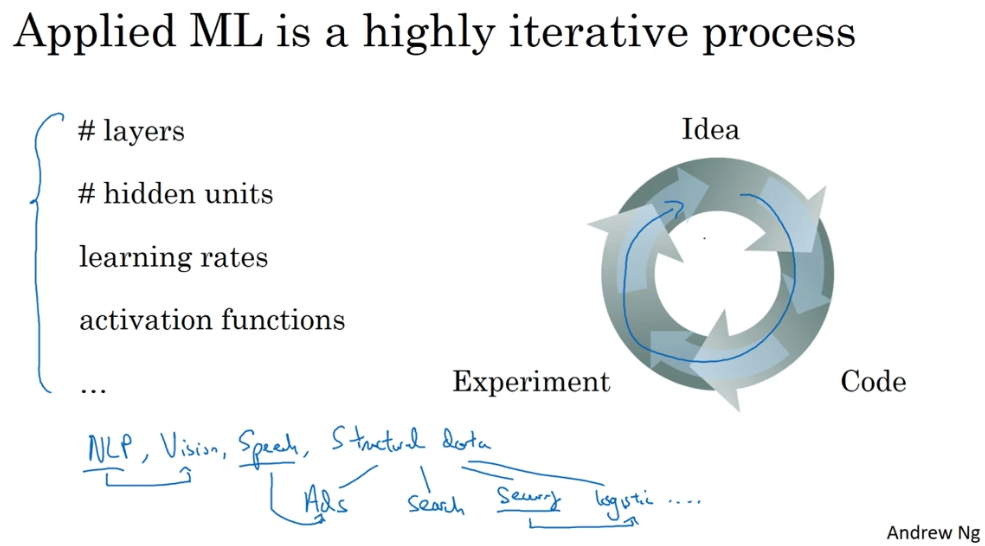
Coursera | Andrew Ng (02-week1)—改善深層神經網絡:深度學習的實用層面 正則化
在吳恩達深度學習視頻以及大樹先生的博客提煉筆記基礎上添加個人理解,原大樹先生博客可查看該鏈接地址大樹先生的博客- ZJ Coursera 課程 |deeplearning.ai |網易云課堂 CSDN:http://blog.csdn.net/junjun_zhao/article/details/79229961 1.1 Train dev test sets (訓練、開發、測試、數據集) 學習...

Machine Learning(Andrew Ng)ex2.logistic regression
Exam1 Exam2 Admitted 0 34.623660 78.024693 0 1 30.286711 43.894998 0 2 35.847409 72.902198 0 3 60.182599 86.308552 1 4 79.032736 75.344376 1 Exam1 Exam2 Admitted 0 34.623660 78.024693 0 1 30.286711 43...


freemarker + ItextRender 根據模板生成PDF文件
1. 制作模板 2. 獲取模板,并將所獲取的數據加載生成html文件 2. 生成PDF文件 其中由兩個地方需要注意,都是關于獲取文件路徑的問題,由于項目部署的時候是打包成jar包形式,所以在開發過程中時直接安照傳統的獲取方法沒有一點文件,但是當打包后部署,總是出錯。于是參考網上文章,先將文件讀出來到項目的臨時目錄下,然后再按正常方式加載該臨時文件; 還有一個問題至今沒有解決,就是關于生成PDF文件...
電腦空間不夠了?教你一個小秒招快速清理 Docker 占用的磁盤空間!
Docker 很占用空間,每當我們運行容器、拉取鏡像、部署應用、構建自己的鏡像時,我們的磁盤空間會被大量占用。 如果你也被這個問題所困擾,咱們就一起看一下 Docker 是如何使用磁盤空間的,以及如何回收。 docker 占用的空間可以通過下面的命令查看: TYPE 列出了docker 使用磁盤的 4 種類型: Images:所有鏡像占用的空間,包括拉取下來的鏡像,和本地構建的。 Con...