Python數據科學入門(seaborn)筆記05
標簽: python
Python數據科學入門筆記05——seaborn
seaborn 是matplotlib的擴展
一、seaborn 實現直方圖和密度圖
import numpy as np
import pandas as pd
import matplotlib.pyplot as plt
from pandas import Series,DataFrame

import seaborn as sns
s1 = Series(np.random.randn(1000))
# distplot() 可以同時繪制多個圖,圖名稱=True
# 默認繪制hist和kde rug 顯示分布密集度 更多參數看文檔
sns.distplot(s1,hist=False,kde=True,rug=True)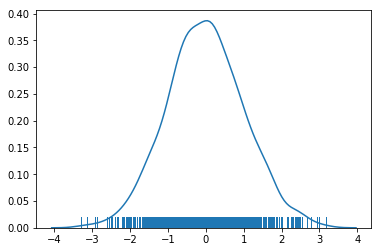
# 密度圖
# shade 是否填充
# kdeplot() /  rugplot() 等
sns.kdeplot(s1,shade=True,color='r')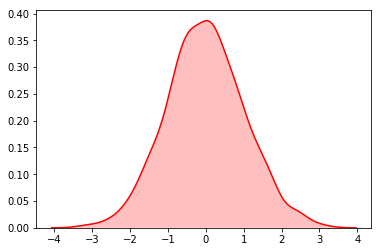
# 直接調用 matplotlib 的api
# 暫時未解決問題
sns.plt.hist(s1)
二、實現柱狀圖和熱力圖
# 下載  seaborn的數據作為實驗數據
# seaborn 在github上有
df = sns.load_dataset('flights')
df.head()| year | month | passengers | |
|---|---|---|---|
| 0 | 1949 | January | 112 |
| 1 | 1949 | February | 118 |
| 2 | 1949 | March | 132 |
| 3 | 1949 | April | 129 |
| 4 | 1949 | May | 121 |
df.shape# 透視表 查看數據更方便
df = df.pivot(index='month',columns='year',values='passengers')
df.head()| year | 1949 | 1950 | 1951 | 1952 | 1953 | 1954 | 1955 | 1956 | 1957 | 1958 | 1959 | 1960 |
|---|---|---|---|---|---|---|---|---|---|---|---|---|
| month | ||||||||||||
| January | 112 | 115 | 145 | 171 | 196 | 204 | 242 | 284 | 315 | 340 | 360 | 417 |
| February | 118 | 126 | 150 | 180 | 196 | 188 | 233 | 277 | 301 | 318 | 342 | 391 |
| March | 132 | 141 | 178 | 193 | 236 | 235 | 267 | 317 | 356 | 362 | 406 | 419 |
| April | 129 | 135 | 163 | 181 | 235 | 227 | 269 | 313 | 348 | 348 | 396 | 461 |
| May | 121 | 125 | 172 | 183 | 229 | 234 | 270 | 318 | 355 | 363 | 420 | 472 |
# 熱力圖
sns.heatmap(df)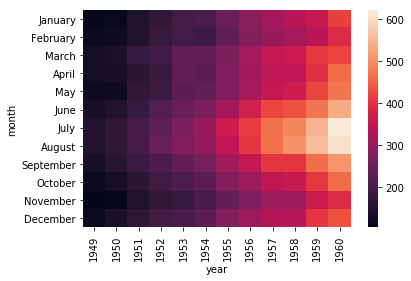
# 柱狀圖
s = df.sum()
sns.barplot(x=s.index,y=s.values)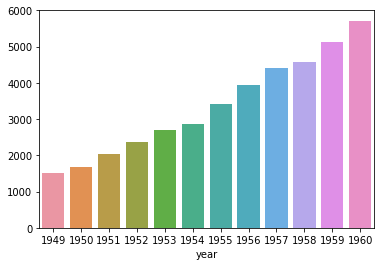
三、seaborn設置圖像效果
1.set_style() 風格設置
x = np.linspace(0,14,100)

y1 = np.sin(x)
y2 = np.sin(x+2)*1.25
def sinplot():
plt.plot(x,y1)
plt.plot(x,y2)import seaborn as sns
# 設置風格 style : dict, None, or one of {darkgrid, whitegrid, dark, white, ticks}
# 設置風格 通過字典形式修改原有參數
sns.set_style("whitegrid",{'grid.color':'red'}) # 上面導入 seabron 后改變了圖像的效果
sinplot()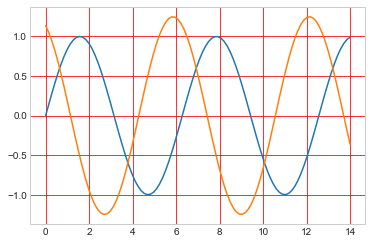
# 查看風格參數 可自行設置
sns.axes_style()
{'axes.facecolor': 'white',
'axes.edgecolor': '.8',
'axes.grid': True,
'axes.axisbelow': True,
'axes.linewidth': 1.0,
'axes.labelcolor': '.15',
'figure.facecolor': 'white',
'grid.color': 'red',
'grid.linestyle': '-',
'text.color': '.15',
'xtick.color': '.15',
'ytick.color': '.15',
'xtick.direction': 'out',
'ytick.direction': 'out',
'xtick.major.size': 0.0,
'ytick.major.size': 0.0,
'xtick.minor.size': 0.0,
'ytick.minor.size': 0.0,
'legend.frameon': False,
'legend.numpoints': 1,
'legend.scatterpoints': 1,
'lines.solid_capstyle': 'round',
'image.cmap': 'rocket',
'font.family': ['sans-serif'],
'font.sans-serif': ['Arial',
'DejaVu Sans',
'Liberation Sans',
'Bitstream Vera Sans',
'sans-serif']}
# 還原默認設置
sns.set()
sinplot()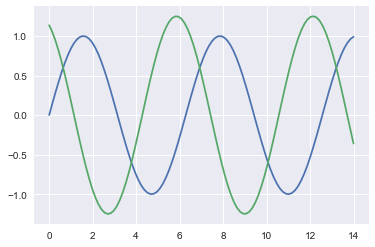
2.更改曲線屬性 plotting_context() 和 set_context()
# seaborn 設置的 幾種context
context = ['paper','notebook','talk','poster']
# rc={} 修改原有參數
sns.set_context(context[2],rc = {'grid.linewidth':3})
sinplot()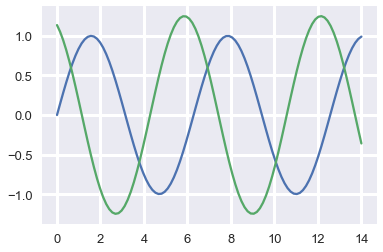
# 查看當前 context 參數
sns.plotting_context()
{'font.size': 15.600000000000001,
'axes.labelsize': 14.3,
'axes.titlesize': 15.600000000000001,
'xtick.labelsize': 13.0,
'ytick.labelsize': 13.0,
'legend.fontsize': 13.0,
'grid.linewidth': 3.0,
'lines.linewidth': 2.275,
'patch.linewidth': 0.39,
'lines.markersize': 9.1,
'lines.markeredgewidth': 0.0,
'xtick.major.width': 1.3,
'ytick.major.width': 1.3,
'xtick.minor.width': 0.65,
'ytick.minor.width': 0.65,
'xtick.major.pad': 9.1,
'ytick.major.pad': 9.1}
四、seaborn的調色功能
def sinplot2():
    x = np.linspace(0,14,100)
    plt.figure(figsize=(8,6))  # 設置畫布大小
    for i in range(4):
        plt.plot(x,np.sin(x+i)*(i+0.75),label='sin(x+%s)*(%s+0.75)'%(i,i))
        plt.legend()
sinplot2()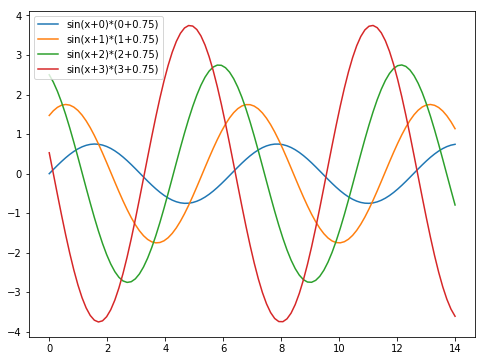
# 導入 seaborn 修飾圖像
import seaborn as sns
sns.set_style(style='darkgrid')
sinplot2()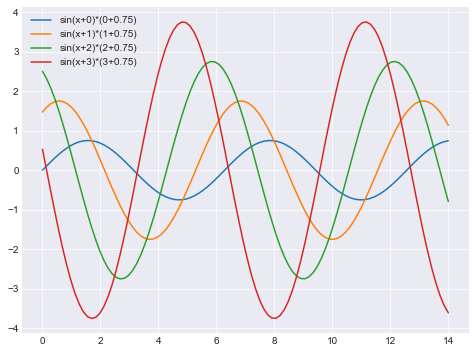
調色
sns.color_palette() # RGB 顏色取值[(0.12156862745098039, 0.4666666666666667, 0.7058823529411765),
(1.0, 0.4980392156862745, 0.054901960784313725),
(0.17254901960784313, 0.6274509803921569, 0.17254901960784313),
(0.8392156862745098, 0.15294117647058825, 0.1568627450980392),
(0.5803921568627451, 0.403921568627451, 0.7411764705882353),
(0.5490196078431373, 0.33725490196078434, 0.29411764705882354),
(0.8901960784313725, 0.4666666666666667, 0.7607843137254902),
(0.4980392156862745, 0.4980392156862745, 0.4980392156862745),
(0.7372549019607844, 0.7411764705882353, 0.13333333333333333),
(0.09019607843137255, 0.7450980392156863, 0.8117647058823529)]
# 繪制 color_palette() 顏色板
sns.palplot(sns.color_palette())
# coclor_palette 里定義的顏色名
pal_style = ['deep', 'muted', 'bright', 'pastel', 'dark', 'colorblind']sns.palplot(sns.color_palette('bright'))
設置調色板
sns.set_palette(sns.color_palette('bright'))# 修改顏色版 即顏色組合后后繪制的圖像
sinplot2()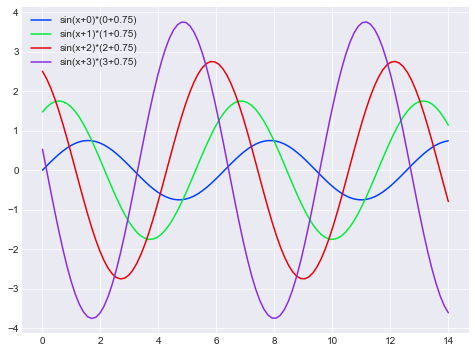
# 恢復默認風格
sns.set()
# 使用 with 語句 ,在with 語句中畫圖會使用其設置的風格
# 在 with 外使用默認風格
# 也就是說 with 臨時設置風格
with sns.color_palette('dark'):
    sinplot2()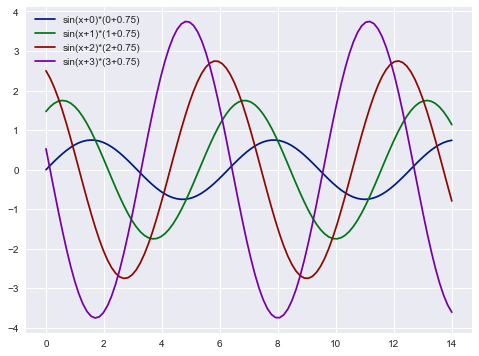
# 傳入數值 設置自己的畫板

# RGB 值
pal = sns.color_palette([(0.5,0.2,0.4),(0.3,0.9,0.2)])
sns.palplot(pal)
sns.palplot(sns.color_palette('hls',8))
智能推薦
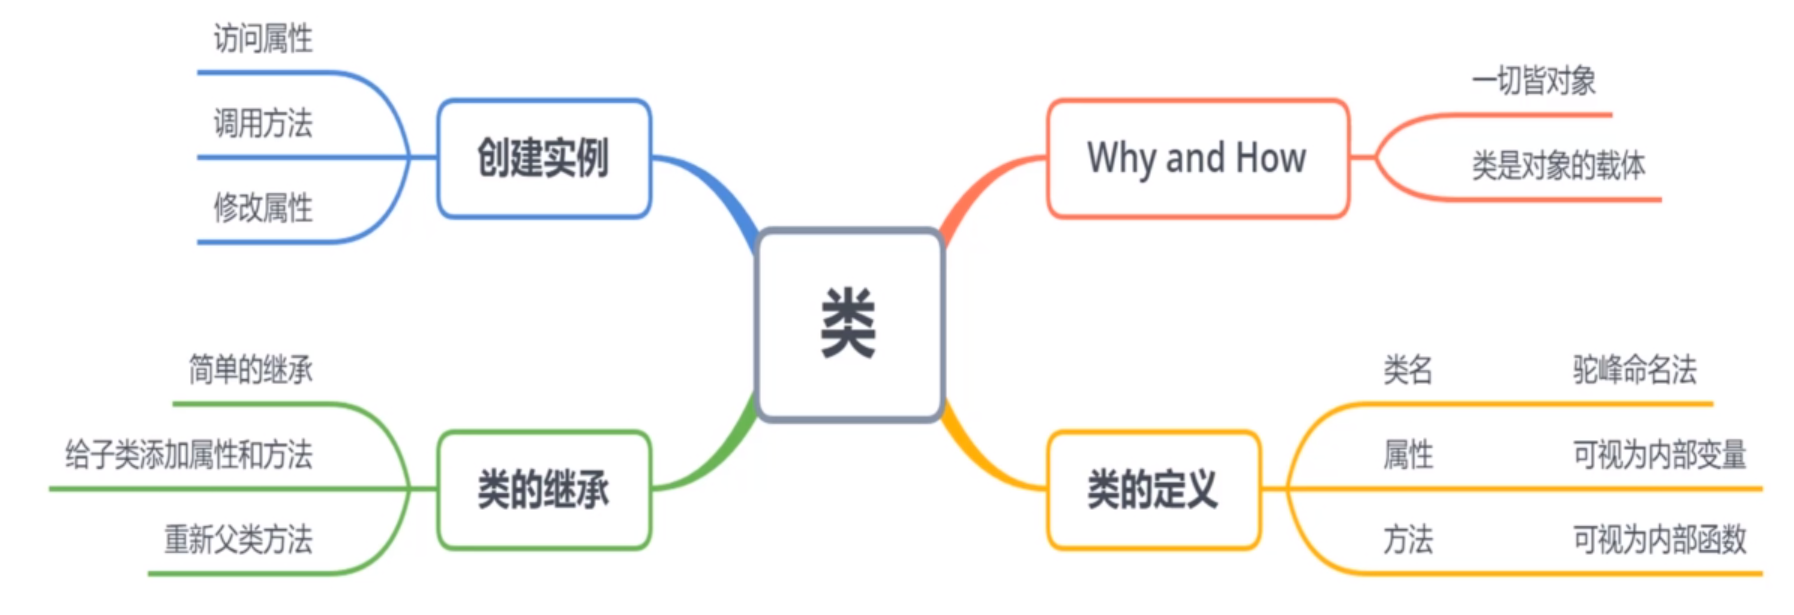
Python基礎+數據科學入門(六)類
聲明:該博客參考深度之眼的視頻課程,如有侵權請聯系小編刪除博文,謝謝! 若總結有所失誤,還請見諒,并歡迎及時指出。 類-面向對象編程 1.1 類 三要素:類名、屬性、方法 1.1.1 類的命名 要有實際意義 采用駝峰命名法 1.1.2 類的屬性 1.1.3 類的方法 1.2 創建實例 1.2.1 創建實例 將實例賦值給對象,實例化過程中,傳入相應的參數 v = 類名 (必要的初始化參數) 1.2....
Python基礎+數據科學入門(七)
聲明:該博客參考深度之眼的視頻課程,如有侵權請聯系小編刪除博文,謝謝! 若總結有所失誤,還請見諒,并歡迎及時指出。 文件、異常和模塊 1.1 文件的讀寫 1.1.1 文件的打開 文件的打開通用格式 例如:一個簡單的文件讀取 文件路徑 完整路徑,如上面例子所示 程序若與文件在同一文件夾,可簡化成文件名 打開模式 "r"只讀模式,如文件不存在,報錯 "w"覆蓋寫...
Python基礎+數據科學入門(八)
聲明:該博客參考深度之眼的視頻課程,如有侵權請聯系小編刪除博文,謝謝! 若總結有所失誤,還請見諒,并歡迎及時指出。 有益的探索 1.1 數據類型的底層實現 1.1.1 從奇怪的列表說起 錯綜復雜的復制 淺拷貝 對拷貝前后的兩列表分別進行操作 列表的底層實現 引用數組的概念 列表內的元素可以分散的存儲在內存中 列表存儲的,實際上是這些元素的地址!——地址的存儲在內存中是連續的...
《數據科學入門》(一)
生成器和迭代器 list的一個問題是,如果使用range生成一個較大的list,而在使用的時候只使用1個或前幾個,就會造成大量的浪費。(python2) 生成器 是一種可以對其進行迭代的程序(通常是for循環),但是它的值只需要延遲產生(lazily). method one: 在python3中range本身就是lazily的。 ?延遲的缺點是,你只能通過生成器迭代一次,如果需要多次迭代某個對象...
數據分析入門--數據科學框架的搭建--05數學建模
本文基于kaggle入門項目Titanic金牌獲得者的Kernel翻譯而來原文鏈接https://www.kaggle.com/ldfreeman3/a-data-science-framework-to-achieve-99-accuracy 翻譯的比較粗略,大家領會意思就好 5.數學建模 數據科學是數學(即統計學、線性代數等)、計算機科學(即程序...
猜你喜歡
「數據科學」使用 seaborn 進行數據可視化
使用 seaborn 進行數據可視化 seaborn 簡介 布局風格 樣式控制:axes_style() and set_style() 邊框控制:despine() 繪圖元素:plotting_context() 和 set_context() 繪圖 可視化統計關系 relplot 散點圖 線圖 可視化數據集的分布 distplot 直方圖 可視化分類數據 catplot 分類散點圖 分類分布圖...


freemarker + ItextRender 根據模板生成PDF文件
1. 制作模板 2. 獲取模板,并將所獲取的數據加載生成html文件 2. 生成PDF文件 其中由兩個地方需要注意,都是關于獲取文件路徑的問題,由于項目部署的時候是打包成jar包形式,所以在開發過程中時直接安照傳統的獲取方法沒有一點文件,但是當打包后部署,總是出錯。于是參考網上文章,先將文件讀出來到項目的臨時目錄下,然后再按正常方式加載該臨時文件; 還有一個問題至今沒有解決,就是關于生成PDF文件...
電腦空間不夠了?教你一個小秒招快速清理 Docker 占用的磁盤空間!
Docker 很占用空間,每當我們運行容器、拉取鏡像、部署應用、構建自己的鏡像時,我們的磁盤空間會被大量占用。 如果你也被這個問題所困擾,咱們就一起看一下 Docker 是如何使用磁盤空間的,以及如何回收。 docker 占用的空間可以通過下面的命令查看: TYPE 列出了docker 使用磁盤的 4 種類型: Images:所有鏡像占用的空間,包括拉取下來的鏡像,和本地構建的。 Con...

requests實現全自動PPT模板
http://www.1ppt.com/moban/ 可以免費的下載PPT模板,當然如果要人工一個個下,還是挺麻煩的,我們可以利用requests輕松下載 訪問這個主頁,我們可以看到下面的樣式 點每一個PPT模板的圖片,我們可以進入到詳細的信息頁面,翻到下面,我們可以看到對應的下載地址 點擊這個下載的按鈕,我們便可以下載對應的PPT壓縮包 那我們就開始做吧 首先,查看網頁的源代碼,我們可以看到每一...