google機器學習框架tensorflow學習筆記(七)
使用Tensorflow的基本步驟
linear_regressor 上調用 train() 來訓練模型。我們會將 my_input_fn 封裝在 lambda 中,以便可以將 my_feature 和 target 作為參數傳入,首先,我們會訓練 100 步。input_fn = lambda:my_input_fn(my_feature, targets),
steps=100
)
我們基于該訓練數據做一次預測,看看我們的模型在訓練期間與這些數據的擬合情況。
# Create an input function for predictions.
# Note: Since we're making just one prediction for each example, we don't
# need to repeat or shuffle the data here.
prediction_input_fn =lambda: my_input_fn(my_feature, targets, num_epochs=1, shuffle=False)

# Call predict() on the linear_regressor to make predictions.
predictions = linear_regressor.predict(input_fn=prediction_input_fn)

# Format predictions as a NumPy array, so we can calculate error metrics.
predictions = np.array([item['predictions'][0] for item in predictions])

# Print Mean Squared Error and Root Mean Squared Error.
mean_squared_error = metrics.mean_squared_error(predictions, targets)
root_mean_squared_error = math.sqrt(mean_squared_error)
print "Mean Squared Error (on training data): %0.3f" % mean_squared_error
print "Root Mean Squared Error (on training data): %0.3f" % root_mean_squared_errorRoot Mean Squared Error (on training data): 237.417
這是出色的模型嗎?您如何判斷誤差有多大?
由于均方誤差 (MSE) 很難解讀,因此我們經常查看的是均方根誤差 (RMSE)。RMSE 的一個很好的特性是,它可以在與原目標相同的規模下解讀。
我們來比較一下 RMSE 與目標最大值和最小值的差值:
min_house_value = california_housing_dataframe["median_house_value"].min()
max_house_value = california_housing_dataframe["median_house_value"].max()
min_max_difference = max_house_value - min_house_value

print "Min. Median House Value: %0.3f" % min_house_value
print "Max. Median House Value: %0.3f" % max_house_value
print "Difference between Min. and Max.: %0.3f" % min_max_difference
print "Root Mean Squared Error: %0.3f" % root_mean_squared_errorMax. Median House Value: 500.001
Difference between Min. and Max.: 485.002
Root Mean Squared Error: 237.417
我們的誤差跨越目標值的近一半范圍,可以進一步縮小誤差嗎?
這是每個模型開發者都會煩惱的問題。我們來制定一些基本策略,以降低模型誤差。
首先,我們可以了解一下根據總體摘要統計信息,預測和目標的符合情況。
calibration_data["predictions"] = pd.Series(predictions)
calibration_data["targets"] = pd.Series(targets)
calibration_data.describe()
好的,此信息也許有幫助。平均值與模型的 RMSE 相比情況如何?各種分位數呢?
我們還可以將數據和學到的線可視化。我們已經知道,單個特征的線性回歸可繪制成一條將輸入 x 映射到輸出 y 的線。
# Get the min and max total_rooms values.
x_0 = sample["total_rooms"].min()
x_1 = sample["total_rooms"].max()

# Retrieve the final weight and bias generated during training.
weight = linear_regressor.get_variable_value('linear/linear_model/total_rooms/weights')[0]
bias = linear_regressor.get_variable_value('linear/linear_model/bias_weights')

# Get the predicted median_house_values for the min and max total_rooms values.
y_0 = weight * x_0 + bias
y_1 = weight * x_1 + bias

# Plot our regression line from (x_0, y_0) to (x_1, y_1).
plt.plot([x_0, x_1], [y_0, y_1], c='r')

# Label the graph axes.
plt.ylabel("median_house_value")
plt.xlabel("total_rooms")

# Plot a scatter plot from our data sample.
plt.scatter(sample["total_rooms"], sample["median_house_value"])

# Display graph.
plt.show()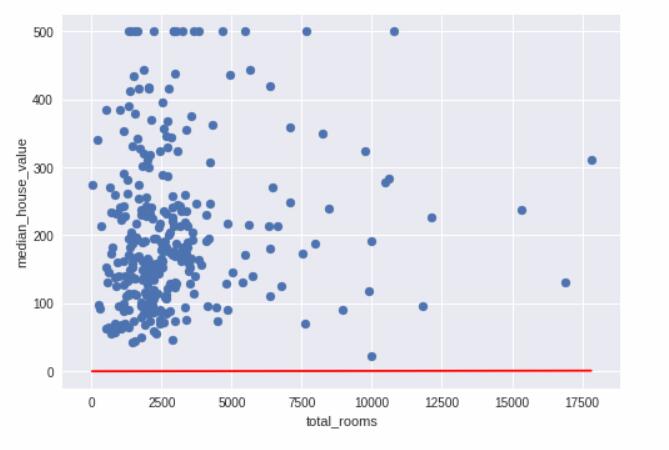
這條初始線看起來與目標相差很大。看看您能否回想起摘要統計信息,并看到其中蘊含的相同信息。
綜上所述,這些初始健全性檢查提示我們也許可以找到更好的線。
智能推薦
《TensorFlow-實戰Google深度學習框架》學習筆記 計算圖、張量、會話
3.1 TensorFlow計算模型——計算圖 Tensor:是張量,可以簡單理解為多維數組,相當于表明了數據結構 Flow:是流,表達張量之間通過計算相互轉化的過程...
【TensorFlow實戰Google深度學習框架】學習筆記(圖像識別與卷積神經網絡)
1、圖像識別經典數據集Cifar cifar是32x32x3的彩色圖片集 2、卷積神經網絡簡介 3、卷積神經網絡常用的結構 3.1卷積層 Filter的深度就是Filter的個數 3.2池化層 4、經典卷積神經網絡模型 卷積神經網絡結構的問題 卷積層和池化層的參數配置問題 5、卷積網絡的遷移學習 遷移學習可以總結為在別人成功的模型(網絡結構和訓練好的參數)的基礎上修改、增減自己的網絡結構。這樣做的...
【Google 機器學習筆記】十、TensorFlow 2.1 實戰(二)基本圖像分類(MNIST)
【Google 機器學習筆記】 十、TensorFlow 2.1 實戰(二)基本圖像分類 為節省時間,降低學習成本,本節實戰的圖片分類對象 tf.keras 中內置的 MNIST 數據集。 首先回顧機器學習編程的幾個基本步驟 1. 數據 &em...
Tensorflow【實戰Google深度學習框架】—使用 TensorFlow 實現模型
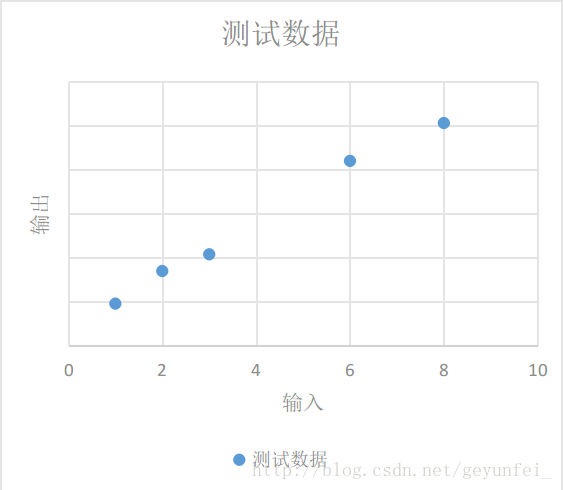
文章目錄 1.建立模型(Model) 2.使用 TensorFlow 實現模型 3.使用 TensorFlow 訓練模型 1.建立模型(Model) 如下為我們進行某項實驗獲得的一些實驗數據: 我們將這些數據放到一個二維圖上可以看的更直觀一些,如下,這些數據在圖中表現為一些離散的點 我們需要根據現有的這些數據歸納出一個通用模型,通過這個模型我們可以預測其他的輸入值產生的輸出值。 如下圖,我們選擇的...
google 機器學習速成課程 筆記1
學習谷歌的機器學習速成課程 標簽:標簽是我們要預測的事物,也就是y 特征:特征是輸入變量,也就是x,按照如下方式指定{x1,x2,x3….,xN},合適的特征應該是具體可量化的,for example,喜歡不是可觀察且可量化的指標,鞋的美觀程度也不是,但是鞋碼和用戶點擊鞋子描述的次數是一種具體可量化的指標。 樣本:指數據的特定實例,有標簽樣本和無標簽樣本 模型:模型定義了特征和標簽之...
猜你喜歡
《Tensorflow機器學習實戰》筆記
2.7:tensorflow實現模型優化 步驟:1)定義輸入數據 2)定義目標數據(label) 3)定義輸入的placeholder 4)定義目標的placeholder 5)定義需要更新的權重(tf.Variable) 6)定義目標的產生方式(輸入數據與權重之間的運算) 7)定義損失函數 8)聲明優化器 9)在循環中將數據送入優化器進行優化 書中學習速率為0.002,運行結果較差,當改為0.5...
《TensorFlow:實戰Google深度學習框架(第二版)》筆記【7-12章】
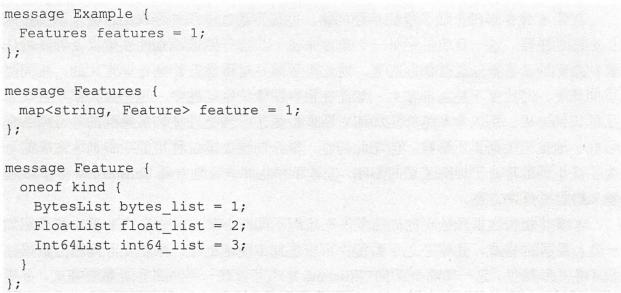
第七章 圖像數據處理 本章介紹如何對圖像進行預處理使得模型盡可能不被無關因素(亮度、對比度等)所影響,同時使用多線程處理提高效率。 TFRecord輸入數據格式 tf提供了一種統一的格式存儲數據,TFRecord。第六章中花朵分類使用了字典存儲數據,這種方式擴展性很差。TFRecord可以有效地記錄來源更加復雜、信息更加豐富的數據。 TFRecord的數據都是通過tf.train.Example ...
《TensorFlow:實戰Google深度學習框架(第二版)》筆記【1-6章】
本書PDF 密碼: uj6t 代碼:https://github.com/caicloud/tensorflow-tutorial 第一章:深度學習簡介 在大部分情況下,在訓練數據達到一定數量之前,越多的訓練數據可以使邏輯回歸算法對未知郵件做出的判斷越精準。之所以說在大部分情況下,是因為邏輯回歸算法的效果除了依賴于訓練數據,也依賴于從數據中提取的特征。假設從郵件中抽取的特征只有郵件發送的時間,那么...
04.深層神經網絡------《Tensorflow實戰Google深度學習框架》筆記
一、深度學習與深層神經網絡 維基百科對深度學習的定義:一類通過多層非線性變換對高復雜性數據建模算法的合集。又由于深層神經網絡是實現“多層非線性變換”最常用的一種方法,所以在實際中基本上可以認為深度學習就是深層神經網絡的代名詞。深度學習有兩個非常重要的特性-----多層和非線性。 1、線性模型的局限性 在線性模型中,模型...
